Python FXで役立つコード
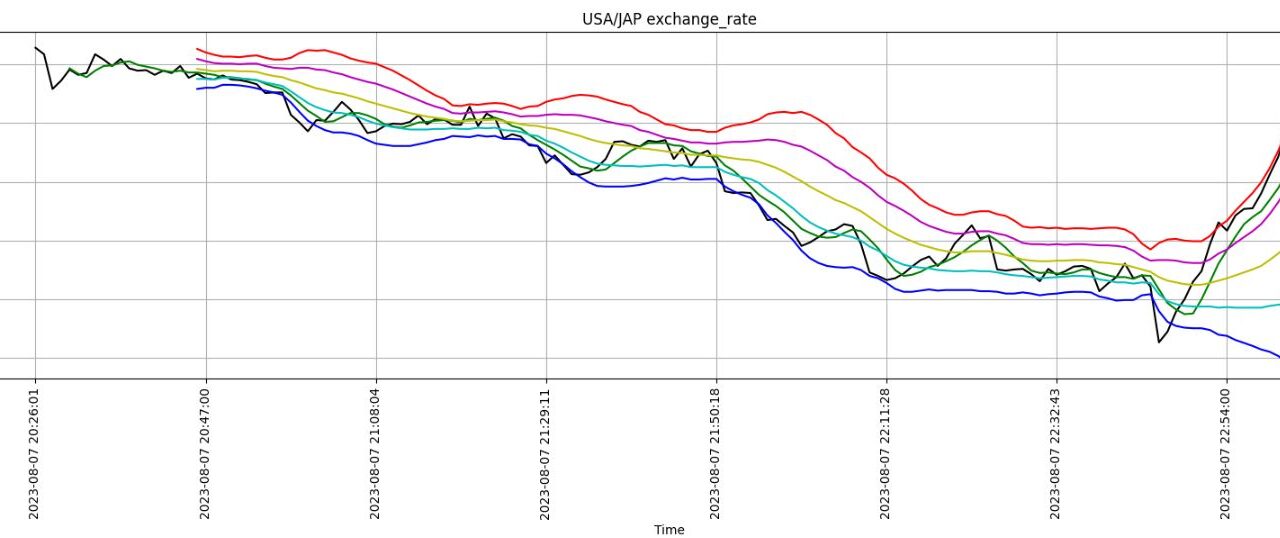
- Pythonを使用した移動平均線及び移動平均線の傾きの算出方法
- Pythonを使用したボリンジャーバンドのグラフ作成方法
- 無料のAPIを使ったFXチャートのリアルタイム更新方法
(本記事のコードを作成した開発環境はGoogle Colaboratory Python 3.10.12 となります。)
FX為替トレードの際に使用するテクニカルチャート(移動平均線、ボリンジャーバンド)をPythonを使ってグラフに表示する方法を解説します。また、本記事の後半では無料のAPIを使ってリアルタイムに為替レートを取得し、テクニカルチャートを付与してグラフに表示する方法を解説します。
●テクニカルチャートをPythonを使ってグラフに表示する
- 移動平均線の算出コード
- 移動平均線の傾きの算出コード
- ボリンジャーバンドの算出コード
- グラフの出力コード
- プログラム全体
●APIを使ってリアルタイムに為替レートを取得し、グラフに表示する
- Alpha Vantage API
- プログラム全体
テクニカルチャートをPythonを使ってグラフに表示する
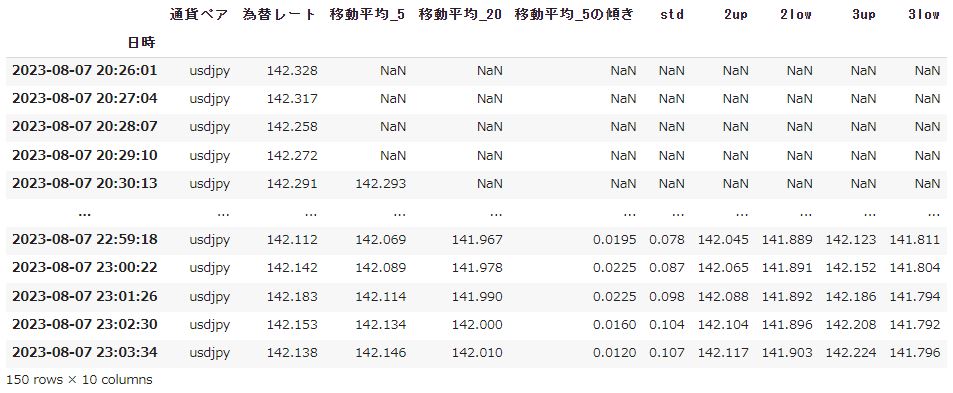
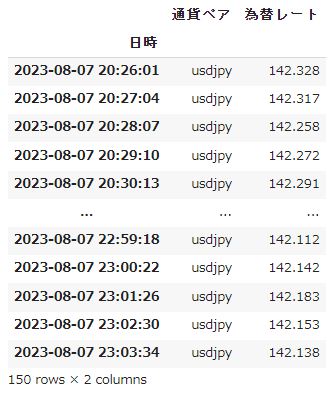
練習用としてエクセルデータ(data)を添付します。本記事では添付したデータをもとにテクニカルチャートを作っていきます。DataFrameにして開くと下記のようになっています。
|
1 2 3 4 |
import pandas as pd df = pd.read_excel('/content/data.xlsx') df = df.set_index('日時') df |
移動平均線
今回は移動平均線の中で最もメジャーな単純移動平均を求めていきます。単純移動平均は、指定された期間内の価格の平均を計算して表示するものです。各期間の価格を合計し、期間で割ることで平均を求めます。トレンドの方向性や傾向を把握することができます。
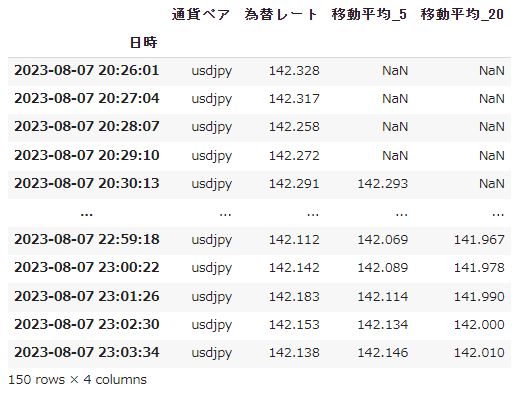
下記コードでは5期間及び20期間の移動平均線を算出し、DataFrame「df」に追加できます。rolling()の引数を変更することで期間をコントロールできます。
|
1 2 3 4 |
#移動平均線 df['移動平均_5'] = round(df['為替レート'].rolling(5).mean(),3) df['移動平均_20'] =round(df['為替レート'].rolling(20).mean(),3) df |
移動平均線の傾き
移動平均線の傾きを求めることでトレンドの向きや強弱が数値で読み取れるようになります。NumPyライブラリのgradient関数を使って移動平均線の傾きを算出ます。
|
1 2 3 4 |
#移動平均線の傾き (前後要素間の傾き 両端は前方(後方)差分) import numpy as np df['移動平均_5の傾き'] = np.gradient(df['移動平均_5']) df |
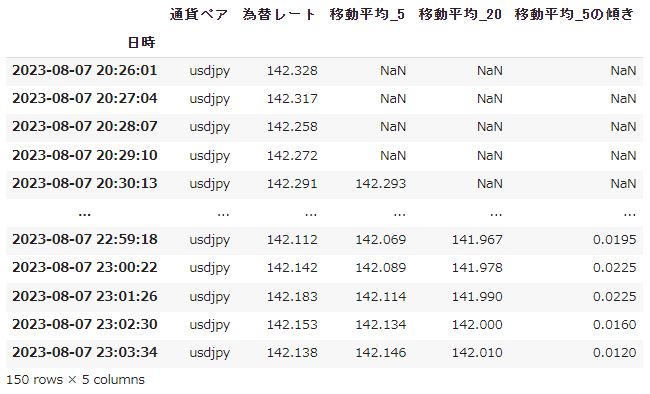
上記コードで「移動平均_5」の行に対し、前後の傾きを求められます。最後の列については後の列がないので前の列との傾きになります。最初の列についても同様で前の列がないので後の列との傾きになります。
ボリンジャーバンド
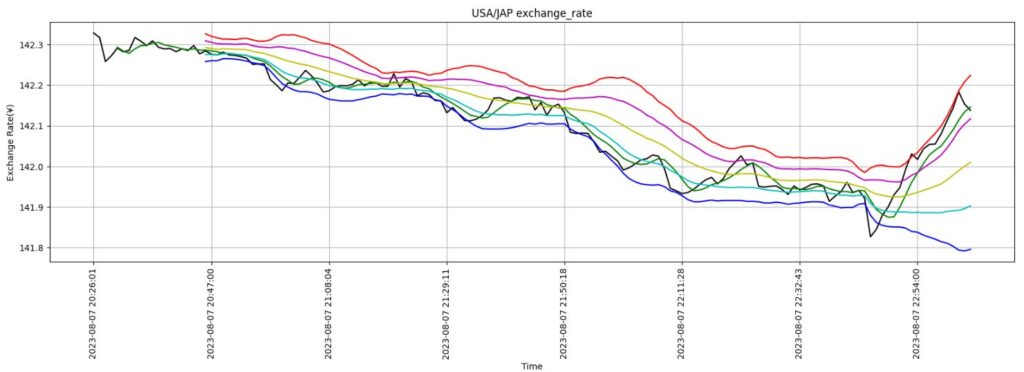
ボリンジャーバンドは移動平均線と移動平均線に対して標準偏差の1~3倍を加算もしくは除算した線を引くテクニカルチャートです。
下記コードで「移動平均_20」に対して、標準偏差の1倍及び2倍のボリンジャーバンドを作成することができます。
|
1 2 3 4 5 6 7 8 9 10 11 |
#ボリンジャーバンド #標準偏差 tailの引数=平均化する要素数(DataFrameの下からの数量) df['std'] = round(df['為替レート'].rolling(20).std(),3) #ボリンジャーバンドも算出 S1,S2は移動平均線から標準偏差×S 分ずらす df['2up'] = round(df['移動平均_20'] + (1 * df['std']),3) df['2low'] = round(df['移動平均_20'] - (1 * df['std']),3) df['3up'] = round(df['移動平均_20'] + (2 * df['std']),3) df['3low'] = round(df['移動平均_20'] - (2 * df['std']),3) df |
グラフの出力
グラフの表示方法については別記事にて紹介しています。
|
1 2 3 4 5 6 7 8 9 10 11 12 13 14 15 16 17 18 19 20 21 22 23 24 25 26 |
# Matplotlibのインポート import matplotlib.pyplot as plt from matplotlib.ticker import AutoLocator # グラフをプロットする plt.plot(df.index , df['為替レート'] , color ="k") plt.plot(df.index , df['移動平均_5'] , color ="g") plt.plot(df.index , df['移動平均_20'] , color ="y") plt.plot(df.index , df['3up'] , color ="r") plt.plot(df.index , df['2up'] , color ="m") plt.plot(df.index , df['2low'] , color ="c") plt.plot(df.index , df['3low'] , color ="b") # グラフのサイズ等の書式変更 plt.xticks(df.index, rotation=90) plt.rcParams["figure.figsize"] = [20,5] plt.grid() plt.gca().xaxis.set_major_locator(AutoLocatorA()) # グラフタイトル、x軸名、y軸名 plt.title('USA/JAP exchange_rate') plt.xlabel('Time') plt.ylabel(f'Exchange Rate(\u00A5)') # グラフを出力する plt.show() |
プログラム全体
|
1 2 3 4 5 6 7 8 9 10 11 12 13 14 15 16 17 18 19 20 21 22 23 24 25 26 27 28 29 30 31 32 33 34 35 36 37 38 39 40 41 42 43 44 |
#DataFrameの読み込み import pandas as pd df = pd.read_excel('/content/data.xlsx') df = df.set_index('日時') #移動平均線 df['移動平均_5'] = round(df['為替レート'].rolling(5).mean(),3) df['移動平均_20'] =round(df['為替レート'].rolling(20).mean(),3) #移動平均線の傾き (前後要素間の傾き 両端は前方(後方)差分) import numpy as np df['移動平均_5の傾き'] = np.gradient(df['移動平均_5']) #ボリンジャーバンド #標準偏差 tailの引数=平均化する要素数(DataFrameの下からの数量) df['std'] = round(df['為替レート'].rolling(20).std(),3) #ボリンジャーバンドも算出 S1,S2は移動平均線から標準偏差×S 分ずらす df['2up'] = round(df['移動平均_20'] + (1 * df['std']),3) df['2low'] = round(df['移動平均_20'] - (1 * df['std']),3) df['3up'] = round(df['移動平均_20'] + (2 * df['std']),3) df['3low'] = round(df['移動平均_20'] - (2 * df['std']),3) #グラフの作成 import matplotlib.pyplot as plt from matplotlib.ticker import AutoLocator # グラフをプロットする plt.plot(df.index , df['為替レート'] , color ="k") plt.plot(df.index , df['移動平均_5'] , color ="g") plt.plot(df.index , df['移動平均_20'] , color ="y") plt.plot(df.index , df['3up'] , color ="r") plt.plot(df.index , df['2up'] , color ="m") plt.plot(df.index , df['2low'] , color ="c") plt.plot(df.index , df['3low'] , color ="b") # グラフのサイズ等の書式変更 plt.xticks(df.index, rotation=90) plt.rcParams["figure.figsize"] = [20,5] plt.grid() plt.gca().xaxis.set_major_locator(AutoLocator()) # グラフタイトル、x軸名、y軸名 plt.title('USA/JAP exchange_rate') plt.xlabel('Time') plt.ylabel(f'Exchange Rate(\u00A5)') # グラフを出力する plt.show() |
APIを使ってリアルタイムに為替レートを取得し、グラフに表示する
Alpha Vantage API
Alpha Vantageは、株式、為替、仮想通貨、指数、テクニカル指標など、さまざまな金融市場に関するデータを取得することができます。
無料枠では下記のような制限があります。
- 1分あたり5回のAPIリクエスト
- 1日あたり500回のAPIリクエスト
下記コードでAlpha Vantageからドル円の為替レートを取得することができます。
|
1 2 3 4 5 6 7 8 9 10 11 12 13 14 15 16 17 18 19 20 21 |
#requestsライブラリのインストール(初回のみ実行) !pip install requests ###為替レート取得### #requestsライブラリを使ってAlpha Vantage APIへアクセス params=辞書型でパラメータを指定 response = requests.get( url = "https://www.alphavantage.co/query" , params = {"function": "CURRENCY_EXCHANGE_RATE", #通貨交換レートと指定 "from_currency":"USD", #USDを変換元通貨として指定 "to_currency":"JPY", #JPYを変換先通貨として指定 "apikey":"YOUR_ALPHA_VANTAGE_API_KEY",#Alpha VantageのAPIキー }) #APIの返信をJSON形式から辞書型へ変換 data = response.json() #リアルタイム為替レートを取得 ("Realtime Currency Exchange Rate" というキーにある "5. Exchange Rate" へアクセス) exchange_rate = data["Realtime Currency Exchange Rate"]["5. Exchange Rate"] exchange_rate = round(float(exchange_rate),3) ######################################## ### Alpha Vantage APIの利用制限 ### ### ・1分あたり5回のAPIリクエスト ### ### ・1日あたり500回のAPIリクエスト ### ######################################## |
リアルタイム更新時のプログラム全体
下記コードは1分に1度更新されるプログラムになります。テクニカルチャートの作成やグラフの表示については前項で紹介したコードの応用になります。
|
1 2 3 4 5 6 7 8 9 10 11 12 13 14 15 16 17 18 19 20 21 22 23 24 25 26 27 28 29 30 31 32 33 34 35 36 37 38 39 40 41 42 43 44 45 46 47 48 49 50 51 52 53 54 55 56 57 58 59 60 61 62 63 64 65 66 67 68 69 70 71 72 73 74 75 76 77 78 79 80 81 82 83 84 85 86 87 88 89 90 91 92 93 94 95 96 97 98 99 100 101 102 103 104 105 106 107 108 109 110 111 112 |
#requestsライブラリのインストール(初回のみ実行) !pip install requests import pandas as pd import numpy as np import datetime import requests import time import matplotlib.pyplot as plt from IPython.display import clear_output #空のDataFrameを作成 df_all = pd.DataFrame(columns = ['データ数','日時','通貨ペア','為替レート','移動平均_5','移動平均_20','移動平均_5の傾き','std','2up','2low','3up','3low']) df_all = df_all.set_index('データ数') #データ数のカウント cnt = 0 while True: ###データ数### cnt += 1 ###時間の取得### dt_now = datetime.datetime.now() dt_now = dt_now.strftime('%Y-%m-%d %H:%M:%S') ###通貨ペア取得### currency_pair = 'usdjpy' ###為替レート取得### #requestsライブラリを使ってAlpha Vantage APIへアクセス params=辞書型でパラメータを指定 response = requests.get( url = "https://www.alphavantage.co/query" , params = {"function": "CURRENCY_EXCHANGE_RATE", #通貨交換レートと指定 "from_currency":"USD", #USDを変換元通貨として指定 "to_currency":"JPY", #JPYを変換先通貨として指定 "apikey":"YOUR_ALPHA_VANTAGE_API_KEY",#Alpha VantageのAPIキー }) #APIの返信をJSON形式から辞書型へ変換 data = response.json() #リアルタイム為替レートを取得 ("Realtime Currency Exchange Rate" というキーにある "5. Exchange Rate" へアクセス) exchange_rate = data["Realtime Currency Exchange Rate"]["5. Exchange Rate"] exchange_rate = round(float(exchange_rate),3) ######################################## ### Alpha Vantage APIの利用制限 ### ### ・1分あたり5回のAPIリクエスト ### ### ・1日あたり500回のAPIリクエスト ### ######################################## ###現時点の情報を df_all にまとめる### df_now = pd.DataFrame([[cnt,dt_now,currency_pair,exchange_rate,'','','','','','','','']], columns = ['データ数','日時','通貨ペア','為替レート','移動平均_5','移動平均_20','移動平均_5の傾き','std','2up','2low','3up','3low']) df_now = df_now.set_index('データ数') df_all = pd.concat([df_all,df_now]) ###移動平均の計算### df_all.loc[cnt,'移動平均_5'] = round(df_all['為替レート'].tail(5).mean(),3) df_all.loc[cnt,'移動平均_20'] = round(df_all['為替レート'].tail(20).mean(),3) ###移動平均線の傾き### dt_data = df_all.tail(5).index.astype(int) ave_line_slope = df_all['移動平均_5'].tail(5).astype(float) #線形回帰 coefficients_ave_line = np.polyfit(dt_data, ave_line_slope, 1) # 1次の多項式(直線)にフィッティング #傾きと切片の取得 slope_ave = coefficients_ave_line[0] #表へ転記 df_all.loc[cnt,'移動平均_5の傾き'] = round(slope_ave,3) ###ボリンジャーバンドの計算### #標準偏差 tailの引数=平均化する要素数(DataFrameの下からの数量) df_all.loc[cnt,'std'] = round(df_all['為替レート'].tail(20).std(),3) #ボリンジャーバンドも算出 S1,S2は移動平均線から標準偏差×S 分ずらす df_all.loc[cnt,'2up'] = round(df_all.loc[cnt,'移動平均_20'] + (2 * df_all.loc[cnt,'std']),3) df_all.loc[cnt,'2low'] = round(df_all.loc[cnt,'移動平均_20'] - (2 * df_all.loc[cnt,'std']),3) df_all.loc[cnt,'3up'] = round(df_all.loc[cnt,'移動平均_20'] + (3 * df_all.loc[cnt,'std']),3) df_all.loc[cnt,'3low'] = round(df_all.loc[cnt,'移動平均_20'] - (3 * df_all.loc[cnt,'std']),3) ###ターミナルへの出力### clear_output() print(cnt ," 時間:",dt_now ," 通貨ペア:",currency_pair ," '為替レート':",exchange_rate ," 移動平均_5の傾き:",df_all.loc[cnt,'移動平均_5の傾き']) ###グラフの作成### # x軸、y軸のデータ Time = df_all['日時'] exchange = df_all['為替レート'] ave_5 = df_all['移動平均_5'] ave_20 = df_all['移動平均_20'] B3up = df_all['3up'] B2up = df_all['2up'] B2low = df_all['2low'] B3low = df_all['3low'] # グラフをプロットする plt.plot(Time , exchange , color ="k") plt.plot(Time , ave_5 , color ="g") plt.plot(Time , ave_20 , color ="y") plt.plot(Time , B3up , color ="r") plt.plot(Time , B2up , color ="m") plt.plot(Time , B2low , color ="c") plt.plot(Time , B3low , color ="b") # グラフのサイズ等の書式変更 plt.xticks(Time, rotation=90) plt.rcParams["figure.figsize"] = [20,5] plt.grid() # グラフタイトル、x軸名、y軸名 plt.title('USA/JAP exchange_rate') plt.xlabel('Time') plt.ylabel('Exchange Rate(\)') # グラフを出力する plt.show() ###更新間隔### time.sleep(60) |
